Class Project: Analyzing Developers’ Online Behavior on StackOverflow
Description
Class: Big Data (Computer Science with Applications III) @ UChicago
Group members: Adam Shelton, Dhruval Bhatt, Li Liu, Sanittawan (Nikki) Tan
Data sets: Stack Overflow Data (around 25 GB after extracting and cleaning)
Date: April-June, 2019
Exploratory Data Analysis
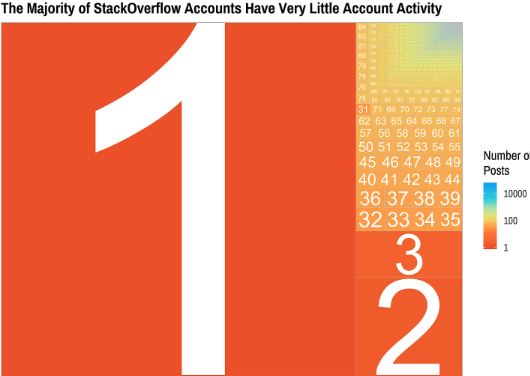
Q1. How active are the users?
A1: Around 80% of the users just asked or answered one question
Q2. What is the most popular question for each year?
A2: Thee type of question has also changed. Earlier, open ended questions with very high number of responses seemed normal and acceptable. However, in the recent years, the questions are specific and seem to target error resolution.

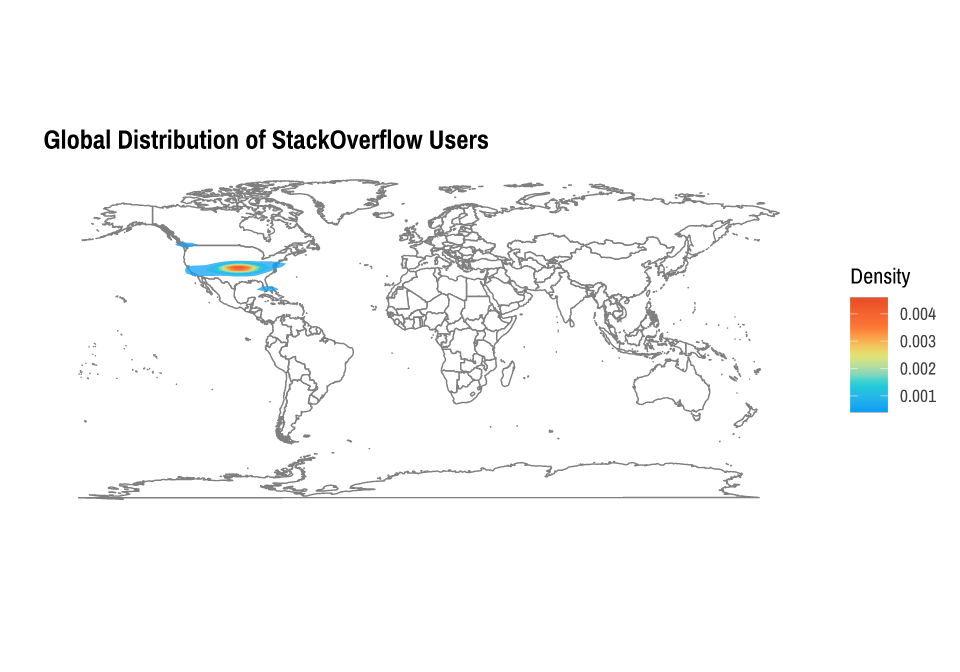
Q3. Where do the users that answer the most come from?
A3: From the results of the subset of data, it can be seen that most active answerers come from United States. Due to the low count of users from all other countries represented, it is hardly visible on the map.
Q4. What are the top used tags?
A4: The graph below shows the top 6 languages and we see that javascript is the top tagged language.

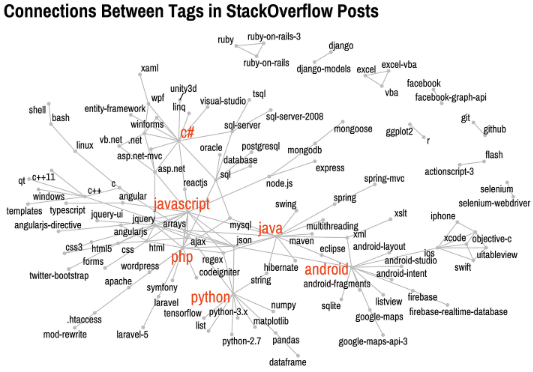
Q5. How are tags connected?
A5: The figure below shows the network of tags formed by the output of the program. From this result, it can be noted that the popular language forms the central nodes of the the network.
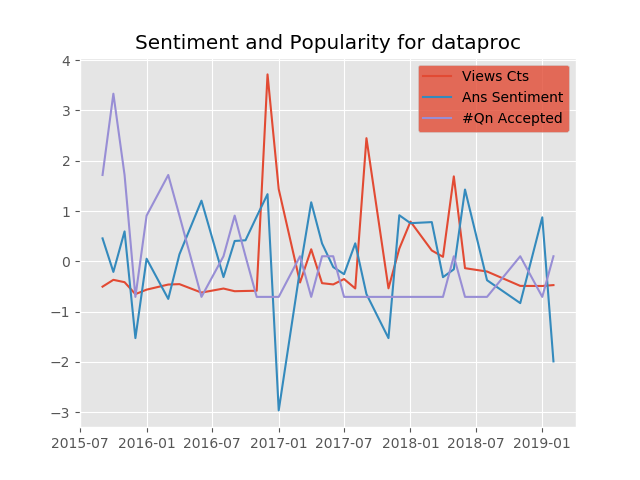
Sentiment v.s. Popularity of the language?

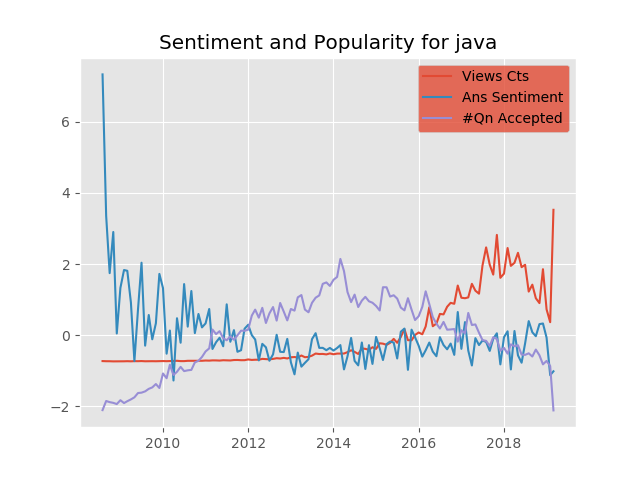
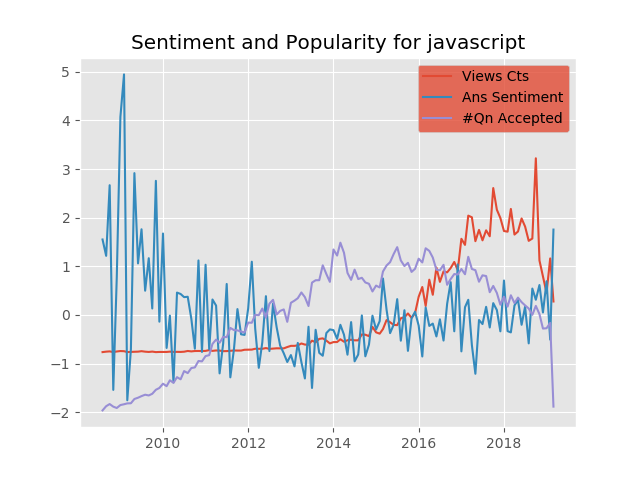
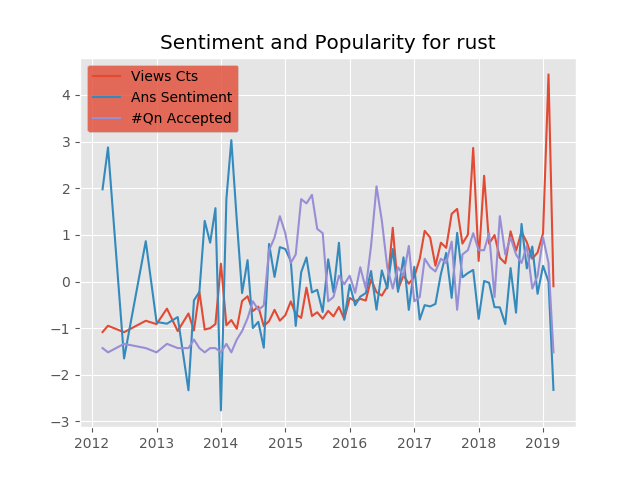
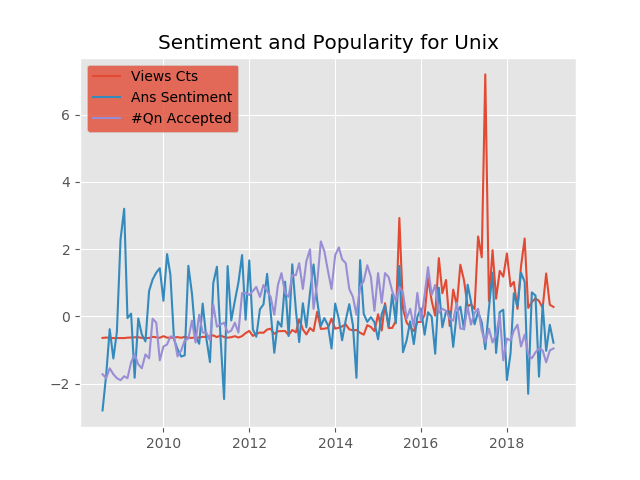
For Python, the popularity (view counts and number of questions) has increased steadily in the past 10 years. However, the sentiment fluctuates between months and has a downward trend since 2010.
Other languages used for the analysis are:
System tools: Unix, Dataproc, Git
General-purpose language: C, Java, Javascript
Language with niche communities: SQL, R, Rust
Results & Visualization
C

Git

Google-cloud-dataproc
Java
Javascript
Python

R

Rust
SQL

Unix
Top programming languages
toptags calculated from decrs_toptags</summary>
'javascript', 'java','c#', 'php', 'android', 'python', 'jquery', 'html', 'c++',

 'ios', 'css', 'mysql', 'sql', 'asp.net', 'ruby-on-rails'
To visualize the correlation relationships, we made a scatter plot of correlations in the coordinate plane. The plot suggests possible clusters among languages: Python, Java, C, Javascript (general-purpose language) have relatively larger negative correlations and are closer with each other in the third quadrant. By comparison, Unix, Git, Dataproc (system tools) have relatively insignificant correlation values and locate near the origin.

Conclusion
Our preliminary results show the correlations between the sentiment and popularity for a programming language are likely to be negatively correlated on Stack Overflow platform. We also find a lot of variations in sentiments and popularity for all the selected 10 languages in the past decade. This suggests that the language user communities are dynamically changing.
Among the users for relatively less popular language, they might have more similar background and interests. So, they probably would have more incentive to build a friendly community by answering questions patiently. However, as a language grows mature, experienced users might regard many new questions as naive and simple, since there are plenty of resources elsewhere.


Leave a Comment